National Snapshot: April Data, Early June Conditions
The buyer-seller imbalance that defined late 2025 and early 2026 began to ease in April. Redfin's monthly report (released May 12, the most recent national reading available) showed buyers coming off the sidelines for the first time since the gap began widening last summer. Mortgage rates have moved the other direction, climbing back through the mid-6 percent range on Iran conflict and inflation pressure. The May closing data from Phoenix and other markets shows buyers continuing to transact despite higher rates.
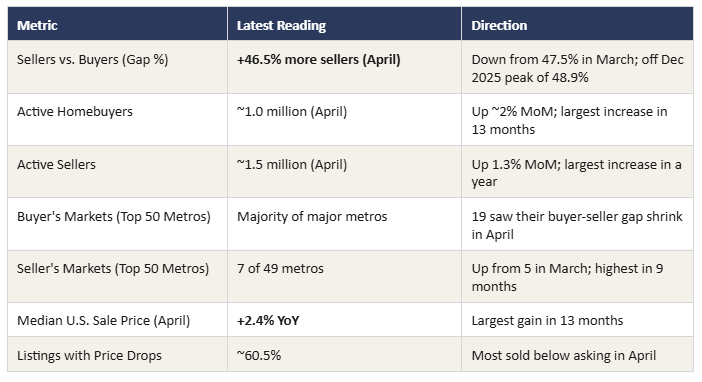
Key National Statistics (April 2026, latest monthly data)
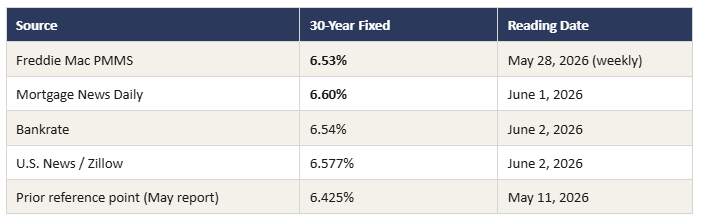
Mortgage Rate Conditions (Early June 2026)
Rates have climbed since the May 11 reading of 6.425 percent. The Iran conflict and tariff pass-through have kept upward pressure on oil prices and inflation, and rates have followed.
March CPI came in at 3.3 percent year-over-year, the highest since May 2024, driven largely by gasoline above $4 per gallon and pass-through tariff effects. April PPI rose 6 percent annually, the largest gain since December 2022. Both readings pushed rates up through May. Forecasts: Fannie Mae projects ~6 percent by year-end. MBA expects 6.30 percent through 2026. Bankrate's full-year forecast is around 6.1 percent. The Iran conflict and inflation trajectory remain the dominant short-term variables.
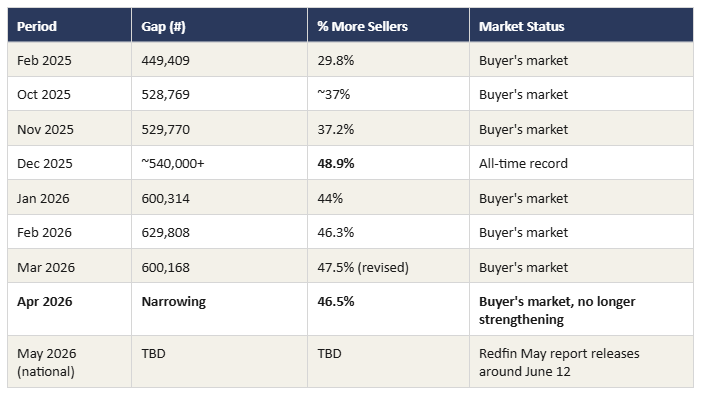
Buyer-Seller Gap: 18-Month Trend
Strongest Buyer's Markets (April 2026)
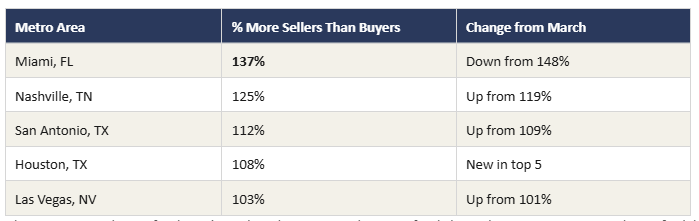
Phoenix is not in the top five buyer's markets, but Greater Phoenix is firmly buyer-leaning per ARMLS and Cromford data, with material variation by city. Austin (previously in the top five) dropped out as its gap narrowed by 5 percentage points in April. West Palm Beach saw the biggest decline of any major metro, down 10.2 percentage points to 80.2 percent.
Strongest Seller's Markets (April 2026)
Seven Northeast and West Coast metros tightened: Nassau County NY (-28.4%), Newark NJ (-25.5%), Montgomery County PA (-24.7%), New Brunswick NJ (-16.5%), Providence RI (-14.3%), San Francisco (-10.9%), and Milwaukee (-10.6%). Negative numbers indicate buyers outnumber sellers. San Francisco has pivoted from a buyer's market to a seller's market on AI-driven demand.
Greater Phoenix Housing Market: May 2026 Closings
Note on data sequencing: the official ARMLS June STAT report (covering May closings) releases around June 15. The figures below are drawn from Cromford Report daily data, Phoenix REALTORS, and the ASREB/Wilcox June 2026 issue, which together provide an early read on May closings ahead of the formal STAT release. The May 2026 STAT (covering April data) is referenced for context.
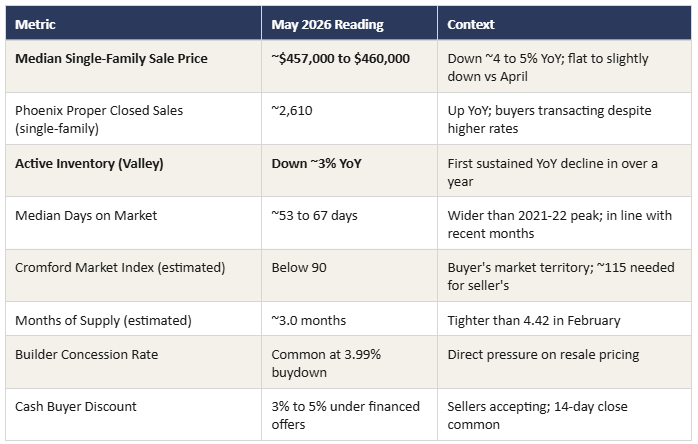
May 2026 Phoenix Snapshot (Early Read)
April 2026 Reference Data (Official ARMLS STAT, released May 8)
The most recent published STAT report gave the cleanest picture of how the market transitioned into May:
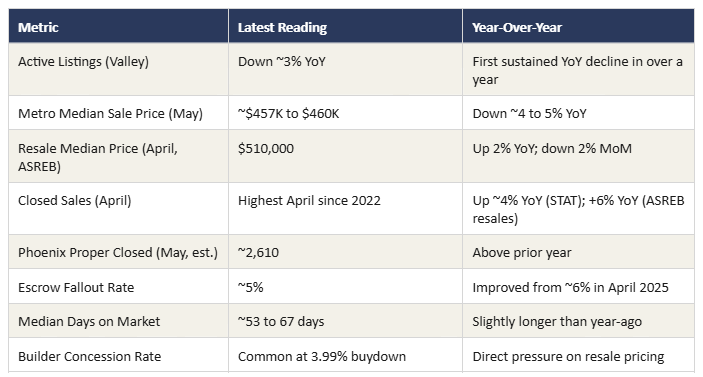
April closings: highest April count since 2022, up ~4 percent year-over-year on the same number of business days.
Escrow fallout rate: improved to ~5 percent from ~6 percent in April 2025, approaching the historical norm of ~4 percent.
Active inventory: down ~3 percent year-over-year, the first April decline after four straight years of increases.
Median active list price: down 3 percent, reflecting widespread price reductions as sellers aligned with buyer demand.
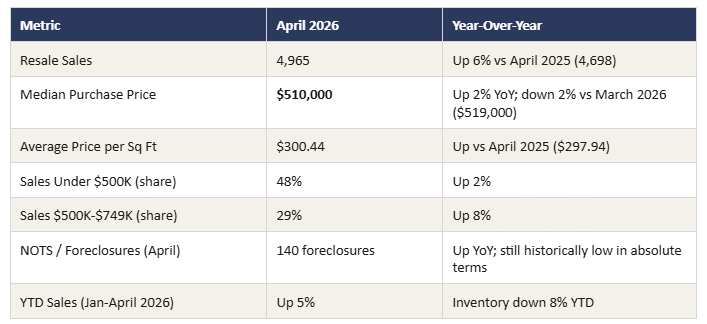
ASREB / Wilcox April Detail (Single-Family Resales)
What This Means: The Story Going Into June
Sales are accelerating. Year-to-date single-family resale sales are up 5 percent through April. April delivered the highest April closing count in four years, and May closings ran above year-ago levels per Cromford daily data. The buyer activation that started in March is sustained, not a one-month event.
Inventory has stopped building. Active inventory is down ~3 percent year-over-year for the first time in over a year. The lock-in effect plus seller withdrawals are tightening supply slightly even as the market remains buyer-favored on the Cromford Market Index.
Pricing remains soft but disciplined. May median sale price near $457K to $460K is roughly 4 to 5 percent below year-ago. Sellers who reduce into bracket are getting movement. Sellers anchoring to 2022 numbers are sitting.
Rate pressure is real. The 30-year fixed climbed from 6.425 percent on May 11 to 6.53 to 6.60 percent in early June. Buyers are transacting anyway, often with seller-paid rate buydowns or concessions. The brief sub-6 percent window in late February is unlikely to return in 2026.
Local Submarket Behavior Is Still Splitting
Greater Phoenix is not one market. Per Cromford data, the Valley splits into three groups:
Seller-leaning (~10 cities): Paradise Valley, Cave Creek, Avondale, and several established central cities with tighter resale inventory.
Near balance (~2 cities): Markets where supply and demand are pacing each other.
Buyer-leaning (~6 cities): Buckeye, Goodyear, Surprise, Scottsdale, Maricopa (Pinal), and Fountain Hills, where elevated inventory from years of aggressive new construction tilts negotiating power toward buyers.
This split matters. A listing in Surprise or Buckeye faces materially different competition than one in Arcadia or central Scottsdale. Pricing strategy must reflect submarket conditions, not Valley-wide averages.
West Valley and New Construction Pressure
New construction continues to expand across the West Valley and Pinal County. Builder rate buydowns near 3.99 percent and seller concessions on more than half of resale transactions in the $200K to $600K price band are direct competition for resale sellers. The Phoenix industrial and residential pipeline remains active: TSMC's continued expansion in North Phoenix, the 2,271-acre Grand View Arizona annexation in Buckeye, the 311-acre Harvest Groves master plan in Gilbert, and the 300-acre industrial rezoning in Maricopa (Pinal) all signal sustained development. The Valley's population has now surpassed 5.2 million, with the fastest growth concentrated in Pinal County and the West Valley.
Foreclosure and Distressed Activity
Notice of Trustee Sales (NOTS) and foreclosures are higher year-over-year on a percentage basis but remain very low in absolute terms. April recorded 140 foreclosures across the metro, up from prior months but still historically low. Distressed listings have grown from approximately 0.1 percent to about 2 percent of total inventory over the past two years. This is normalization off historic lows, not a 2008-style stress signal.
Maricopa County Detail
Maricopa County is the core of the Greater Phoenix MSA and the dominant driver of the statistics above. The combination of April's STAT data and the May early read shows a market that is still buyer-favored, no longer building supply pressure, and showing real buyer activation.
Maricopa County Submarket Highlights
Scottsdale and Paradise Valley: Luxury segment remains resilient. $1M+ closings are a growing share of overall sales. Days on market longer but pricing power preserved in the best locations.
Gilbert, Chandler, Mesa (East Valley): Steady mid-range demand in $450K to $600K. Sellers pricing more carefully. Concessions remain common.
Buckeye, Goodyear, Surprise (West Valley): More supply than the East Valley. Buyers have additional negotiating room and longer decision timelines. New construction inventory is the primary competitive headwind for resale.
Sun City, Sun City West, Sun City Festival: Retirement-community inventory has expanded. Cash buyers still active but with leverage. Pricing must reflect competing listings, not 2022 expectations.
Phoenix proper: May closings around 2,610 single-family resales, above year-ago. Inventory turning over faster as median active list prices reduced through April.
Pinal County Detail
Pinal County (Maricopa city, Casa Grande, Florence, Queen Creek (Pinal portion), San Tan Valley, Coolidge, Gold Canyon, Apache Junction) is the West Valley's fast-growth neighbor and one of the most builder-influenced submarkets in Arizona. It currently sits among the more buyer-leaning portions of Greater Phoenix.
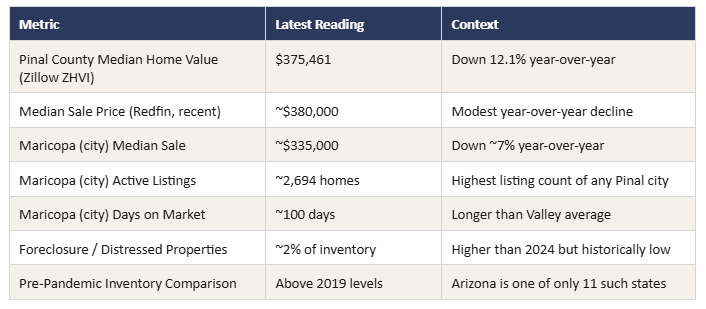
What Is Driving the Pinal Numbers
New construction saturation: Builders have been aggressive in Maricopa (city), San Tan Valley, Casa Grande, and Queen Creek (Pinal). Rate buydowns and incentives directly undercut resale sellers.
Affordability migration: Buyers priced out of central Maricopa County are extending their search radius into Pinal, but only when pricing reflects the longer commute and submarket conditions.
Investor inventory: Some pandemic-era investor purchases in Pinal are reaching resale. Many cannot price aggressively without recognizing losses, which is keeping listings on the market longer.
Population growth: The Valley's growth has shifted measurably toward Pinal County and the West Valley, supporting long-term absorption even with current short-term softness.
What This Means for Your Listing
The May closing data and early June rate environment confirm a market that is still buyer-favored, no longer building supply pressure, and showing the first sustained signs of buyer activation in twelve months. Mortgage rates have climbed off the mid-May lows on Iran conflict and inflation, but Phoenix May closings ran above year-ago and pending sales continue to trend up. Sellers who acknowledge the conditions are getting movement. Sellers who do not are sitting.
The supply story has turned. Active inventory is down ~3 percent year-over-year for the first time in over a year. That does not make this a seller's market. It means the headwind from rising supply has paused, and properly priced listings face less competition than they did last spring.
Price into the right bracket from day one. With buyer leverage still real but no longer growing, the $25K bracket psychology is doing more work than ever. Listing at $499,900 instead of $510,000 puts a home in front of every buyer searching to $500K. Slight overpricing sends buyers to the better-prepared competition.
Address the new construction competitor directly. In Buckeye, Goodyear, Surprise, Maricopa (city), Casa Grande, San Tan Valley, and Queen Creek, the comparison is not just other resales. It is the builder offering a 3.99 percent rate buydown three miles away. Resale pricing and seller-paid rate buydowns must reflect that reality.
Stale listings remain a serious risk. May closings accelerated because buyers activated, not because prices rose. Listings that sit past 30 to 45 days trigger buyer skepticism, especially in submarkets with 90+ day average DOM. The 3 percent decline in median active list price through April was no accident.
Presentation is the differentiator. With buyers requesting inspections and walking on issues, move-in-ready condition is the price of entry, not a premium feature. Address maintenance, paint, landscape, and obvious deferred items before listing.
Phoenix demand is real and structural. TSMC, Intel, LG Energy, Mayo, advanced manufacturing, and healthcare expansion continue to drive high-wage employment. Greater Phoenix remains one of the top relocation destinations in the country. Buyers are present. They are deliberate. They reward properly positioned listings.
The waiting case has gotten weaker. Rates are higher in early June than they were in mid-May. No major forecaster expects meaningful relief before late 2026 or 2027. Waiting for a better market is waiting on conditions that may not arrive in the timeframe most sellers actually need.
The seller who acknowledges these conditions and prices and presents to them is the seller who closes. The seller who anchors to 2022 expectations or to a neighbor's 2024 sale is the seller who reduces in June, reduces again in August, and accepts in September what could have closed in June.
Jason L. Penrose, PLLC | Associate Broker | eXp Realty | The Penrose Team
(602) 536-7587 | Jason@ThePenroseTeam.com | www.BuyAZToday.com